


Purpose: systematic continuous effects mapping
Who is it for: project managers, researchers, quality officers
Technique: interviews, meetings, document analysis
Type of tool: reporting tool
Prior knowledge: little
Complexity: low
Time investment: days
Downloads
Continuous Effects Matrix (in Dutch)
Continuous Effects Matrix (Version 2) (in Dutch)
Links
Van Vliet et al. (2020) – Rapporteren over doorwerking van praktijkgericht onderzoek.
(Reporting on Continuous Effects of Applied Research) Amsterdam: Amsterdam University of Applied Sciences (in Dutch).
Related tools


What is the Continuous Effects Matrix?
The Continuous Effects Matrix is a tool for mapping and reporting on the continuous effects of research. At the core of the matrix is the discussion on the concept of continuous effects as a characterisation of research at universities of applied sciences. Much more than the concept of ‘impact’, ‘continuous effects’ emphasises the effects that already take place during the preparation and implementation of a research project. Knowledge development, knowledge exchange, knowledge circulation and professional development already take place – in collaboration with stakeholders – from the moment the research is formulated (demand articulation). Involvement of the professional field and education in these phases of applied research eliminates the need to wait for an impact after the end of the research project through knowledge transfer or knowledge utilisation. While there is of course an effect at the end of the research period (impact), it does not cover the entire scale of continuous effects of research at universities of applied sciences.
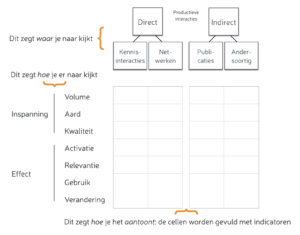
When considering continuous effects, two questions emerge: What do you want to make a statement about? And: What kind of statement do you want to make about that? The first question can be answered by identifying three result areas:
- Products (publications, prototypes, knowledge clips, etc.);
- Networking (advisory committees, expert panels, editorial board, etc.); and
- Knowledge interactions (workshops, panel sessions, courses, etc.).
The second question can be answered by distinguishing and determining six qualia of continuous effects:
- Volume (how much has been done?);
- Nature (what has been done?);
- Quality (what is de quality?);
- Activation (who was reached and activated?);
- Relevance (what value is assigned?); and
- Usability (will it be used?).
The first three qualia are about the effort made, the last three are about the effects of the effort.
Considering these two questions as two dimensions of a matrix creates a systematic overview in which the cells of the matrix contain questions (and answers!) such as: in which networks do we participate (networks – nature)? Are our prototypes being used (products – use)? How many workshops have we held (knowledge interactions – volume)? How relevant do users find our websites (products – relevant)? And so on.
Two modifications have been made in a second version of the 2021 Continuous Effects Matrix. First, the breakdown of products/networks/knowledge interactions has been integrated with the distinction between direct and indirect productive interactions. Productive interactions is a concept developed in the SIAMPI methodology. Second, a qualia has been added, namely change. Ultimately, it is not only about relevance and use but also that use leads to change. The rest of the system remains unchanged.
How do you use the Continuous Effects Matrix?
The Continuous Effects Matrix exists in two variants: a matrix and a decision tree. The matrix can be used as a tool to write a narrative by identifying which aspects the narrative should pay particular attention to, e.g. the different networks the researchers are involved in (networks-nature) and/or the use of certain products resulting from the research (products-use). A second way the matrix can be used is as a systematisation of indicators to describe applied research. Each cell in the matrix can be filled with existing indicators or new indicators can be developed for it (see van Vliet et al., 2020). Indicators can be used to collect examples and data. In this way, a systematic overview is available of what is reported on applied research and any gaps in this reporting can be easily and quickly identified.
Where target groups are not explicitly mentioned in the matrix but can be included in the indicators (number of professional publications, use by stakeholders in education, and so forth.), in the decision tree the target group is the first decision point. The decision tree guides you through a number of choices to a specific set of indicators. Before deploying the Continuous Effects Matrix (and decision tree), three factors should be considered:
- The scope of the report to be prepared. This is often done on the basis of an organisational unit (knowledge centre, research group) or programme-based line (Centre of Expertise, large research programme). But in principle, the scope can also be geographical, e.g. district, city or region. The tools make no statement on this. However, the choice of scope will have consequences for the aspects that matter and how they are weighted.
- The domain to be reported on. Creative industry, healthcare, agriculture and transport are different in essence, which means that the activities and (nature of) outcomes of applied research will differ. These differences must be honoured and taken into account. The Continuous Effects Matrix is domain-neutral, which is both a strength and a weakness. The advantage is that the tool can be used across a wide range of domains and represents a shared framework within a university of applied sciences, for example, making it easier to compare and communicate about research. The drawback is that the uniqueness of a domain is not reflected in the tool. This will have to be introduced by outlining the domain, including questions such as: What is the role of networks in our domain? Which products work best? How does knowledge transfer take place? For each domain, this will lead to a certain weighting of aspects, the choice of indicators and the necessary contextualisation of indicators.
- The form of reporting. The tools do not prescribe the manner of reporting, whether via a report, a video or an infographic. Nor do the tools prescribe whether this should be quantitative, qualitative or a mix. Sometimes it is more obvious to report information quantitatively (e.g. size of a research group), and sometimes it is more obvious to do so qualitatively (e.g. experiences of entrepreneurs involved).
What is the origin of the Continuous Effects Matrix?
The Continuous Effects Matrix was developed at Amsterdam University of Applied Sciences (AUAS). The purpose of the matrix is to make better statements about the impact and continuous effects of research at AUAS. A working group was set up in 2019 to develop a number of tools for this purpose through literature research, working sessions with professors and analyses of critical self-reflections of the centres of excellence. These tools are underpinned by an analysis of the discussion around impact, continuous effects and the use of indicators (see van Vliet et al., 2020). The tools were then used in preparation for reviews of the knowledge centres at AUAS in the autumn of 2021. A second version of the Continuous Effects Matrix was published in 2021.

